Film look · medium
Data Storytelling
Also called: animated chart story, scrollytelling chart, sonified data film
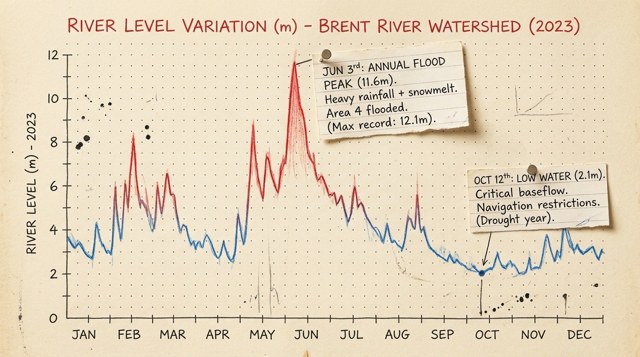
What it is
A chart as the film: real data drawn mark by mark on cream paper by a red-blue pencil, handwritten notes pinned to the numbers, every mark heard as a pitch.
The prompt
Paste it into an image or video prompt as is, then add your own subject.
Prompt
hand-drawn data chart on warm cream paper, ink dots and lines drawn by a red-blue pencil, handwritten pencil notes pinned to marks, red-to-blue diverging colour ramp, faint dot grid, mono tick labels
Not this
What it gets confused with, or how it fails. Use it as a negative prompt where the tool takes one.
Not this
Not a dashboard, not a keynote with chart slides, never decoration: one idea at a time, and the numbers stay true.
The details
- Type that suits it
- Newsreader, Caveat
- Camera native to it
- full view, then dive to one mark, track the pencil along the series, hold on one mark, then pull back
- Sound
- sonification: pitch is value, low-pass-gate plonks, detuned-saw pad, pencil taps on paper
Colours by role
- paper #F5EFDF
- sky #E8E0CB
- land #4393C3
- sun #D6604D
- ink #2A231B
- extra #2166AC
Feels like
Pairs with
- a text serif figure caption
- track the pencil, newest mark at 60% width
- sonified plonks over a soft saw pad